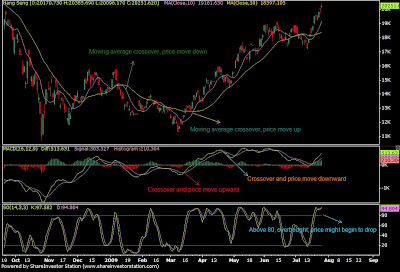
Trending Indicator:
- Simple Moving average crossover: Once the short term moving average cross above the longer moving average, it would usually signal a change in trend to move upward (price go up). When the short term moving average cross below the longer moving, it would usually signal a change in trend to move downward (price go down).
- MACD (Moving average convergence and divergence): Use to generate buy/ sell signal, however the accuracy will have to be combine with other indicator for enhance confirmation.
- Stochastic Oscillator (SO): Use to determine whether a particular stock is overbought/ oversold. I seldom use this to generate buy/ sell signal as it is too sensitive to price changes. I would usually use this in conjunction with MACD to confirm the trend.

Sideway Indicator:
Ocasionally stock price would trade sideway so we would need to use different set of technical indicators catering to sideway trending market. Trending indicators do not work well for sideway market. The indicator that i prefer to use for sideway market is call bollinger band. When stock price hit the upper channel of the band, we would consider that as a sell signal, this upper channel will act as a resistence and prices should not be able to penetrate this upper limit. Whereas the lower band will act as a support for stock price and should not be able to drop below this price. The theory for this method is that prices would move in range bound and you should be trading within the boundaries of the bollinger band. We would trade using this method when market prices is consolidating after a huge price movement either upward or downward. Remember, stock price do not go up or down forever.

The above are just some of the technical indicators. There are many other indicators available. However, these few indicators has serve me well and i believe in keeping my chart as simple and clutter free as possible. There is no point in getting a complicated tehcnical indicators whereby you do not fully understand the benefit of using it.
Now that you have learn to use technical indicators, try to read up some charts using these indicators and try to forecast subsequent future price movements as a practice on paper. Beside technical indicators, we would need to combine it with chart patterns or candlestick to achieve better results. Pls visit the below site to gain a better understanding of how candlestick works.
http://www.candlesticker.com
I shall try to incorporate some candlestick usage and explanation in my next posting. In the mean time, feel free to drop me a comment on any topic that you might be interested in with regards to stock trading and I would do my best to answer them in the subsequent posting on my blog.


It was a awe-inspiring post and it has a significant meaning and thanks for sharing the information.Would love to read your next post too......
ReplyDeleteThanks
Regards:
Commodity Market
Great informational article. I learned quite a bit . I will be using the things I learned from your article.
ReplyDeletetrade4target
Technical Indicators are the often squiggly lines found above, below and on-top-of the price information on a technical chart. Indicators that use the same scale as prices are typically plotted on top of the price bars and are therefore referred to as "Overlays."
ReplyDeleteNatural Gas Tips