- GoldenAgri: Buy @ 0.455, sell at 0.51
- Ausgroup: Buy @ 0.71, sell at 0.8
- Raffles Edu: Buy @ 0.49, sell at 0.58
- Midas: Buy @ 0.865, sell at 0.92
- Yingli: Buy @ 0.785, sell at 0.86
- GuccoLeisure: Buy @ 0.68, sell at 0.78
Thursday, October 8, 2009
New upward trend, new opportunity to trade
Counters that is worth focus are as follows.
Saturday, September 26, 2009
Recommended counters for short term trading
For those who favors trading blue chip counters, I have listed some counters for your consideration.
Mid and small caps counters are as follow:
- Capitaland: Target buy at $3.64 and target sell at $3.94
- Golden Agri: Target buy at $0.435 and target sell at $0.465
- Cosco: Target buy at $1.2 and target sell at $1.26
Mid and small caps counters are as follow:
- Yangzijiang: Target buy at $0.965 and target sell at $1.01
- Great Group: Target buy at 0.395 and target sell at $0.45
- ChinaAniH: Target buy at $0.255 and target sell (t.b.a)
- Medtecs: Target buy at $0.145 and target sell at $0.2
Sunday, August 30, 2009
Impact of Japan election
The landslide victory of the opposition in Japan will cause stock prices to rise for the next two days due to anticipation of positive changes by investors. The Yen will rise as a result which in turn causes the dollar to drop. Furthermore, due to the easing of recession, demand for oil will be expected to turn better. This will create support for oil price between the range of USD$70 - USD$75.
The positive news in Japan will most likely lead asia market to rise irrgardless of the poor performance by US market on last friday. However, the joker in the pack will be China. How will China react to this piece of news? China have been on a downward correction for two weeks, this has causes capping ripple effect on the rest of asia market. Nevertheless, this does not means that there will be major correction happening anytime soon.
For this week, focus on mid cap companies and penny stocks. These will be the ones which are likely to have more play. Blue chip companies should be having its stock price correction or sideway trading for this week. As a result index will unlikely rally too much for this week nor will it fall that much due to bargain hunter entering the market to purchase.
Thursday, August 27, 2009
Stock tips
Just observe there is an opportunity to buy swiber today when Singapore market open. Buy at below 1.02. By next week, oil prices should begin to strengthen and this will result in swiber appreciating in stock price. Tentative sell price for swiber will be at 1.1. Pls exercise cautions and implement cutloss strategy when investing.
Current stock market trend at the moment
For those with an eyes for detail, you would notice that even though the index was in the red, small cap companies are still rallying. The economic situation may have improved slightly but investors attention have turned to growth instead. Investors have grown tired of knowing that the recession is ending and now they are expecting more. The next rally would most likely be trigger by anticipation of growth, till then, the straits times index will most likely be hovering and sideway trade for awhile.
Therefore, in the mean time, you can consider trading on the mid cap and small counters whereby speculators are in play. Do take a look at JES, can consider to buy at 0.23 and sell at 0.26. MACD and stochastic oscillator are both showing bullish buy call. Do remember to exercise caution while trading and implement a cutloss strategy.
Tuesday, August 25, 2009
Possible short term stock gain
Below are the buy recommendation based on my personal analysis for your consideration and reference . Please exercise cutloss in the event of adverse market condition.
- Yongnam: Buy at 0.31, sell at 0.36 or when price touches 10 simple moving average
- Bayan Tree: Buy at 0.96, sell at 1.05 or when price touches 10 simple moving average
Purely speculatvie or gambling, can try to buy SUNMOON at 0.005. Try your luck to sell at 0.01 everyday. Potential profit of 100%. Pls do not use contra trading for this counter as you would need to hold to make money. Do not place a big position on this counter (recommended to be below $3,000). The max price for this share is most likley 0.01 only so do not try your luck to sell at 0.015. The rationale for buying this stock is to rely on the bull trend to attract speculator of penny stocks to come in and push up the price of this counter.
Friday, August 21, 2009
New uptrend spotted in US market
A new uptrend for the US market has emerge. Time to enter market to buy. Some of the counters to watch out are as follows:
- HongFok: Buy at 0.695, sell when price touch the line of 10 simple moving average
- Swiber: Buy at 0.93, sell at $1
- Allgreen: Buy at 1.14, sell when price touch the line of 10 simple moving average
- Capitaland: Buy at 3.66, sell when price touch the line of 10 simple moving average
- Ausgroup: Buy at 0.63, sell when price touch the line of 10 simple moving average
Pls remember to exercise cutloss strategy if you are contra trader. If you are using cash to hold, you would not need to panic even if the prices fall because you can still hold on to it.
Wednesday, August 19, 2009
The China Impact on Global Market
The stock market in China have been dropping rapidly for the past two weeks. At the present moment, the moving average crossover as per the chart has shown a downward pressure in the near term.
The stock rally which we have experienced was initially triggered by China stock market. And my point of view is that we might be going through a series of correction. There might be further downside to the Singapore and US market. Commodities counter will be under pressure and stock prices for them based on my view would drop a futher 10% or when the China stock market has stablise and stop dropping so dramatically.
In the mean time as a trader, you might wish to look at opportunity to short commodities related counters whenever it has rally.
Monday, August 17, 2009
5 key signal to determine whether market is pulling back
Just read a very interesting article online and decided to put the key point here for you to read. In order to determine whether is there a correction in the market, we can look at the following key points.
- The strength of the economy must show signs of consistent growth (No market has shown consistent growth past two quarters yet)
- Commodities and Oil prices must be consistently moving higher ( At the moment it is dropping)
- Companies sales result must be increasing and profit achieve through increased sales, not just cost cutting. ( Companies are reporting profit due to cost cutting measures at the moment)
- Investors sentiment plays a big part, when too many people are too optimistic about the stock prices to appreciate, it will usually go down
- China stock prices must be increasing in order for the asia stock market to carry on rallying
The full article can be accessed here.
Sunday, August 16, 2009
Differences in mentality of trader and investor
I have talked to a lot of people who confuse themeselves and fail to identify whether are they an investor or trader. In my point of view, it is extremely important to be clear and concise about this since the strategy used would then be totally different.
As a trader, you generate cash flow within a short time span such as a few days, weeks or even daily. However, the risk exposure would usually be higher since you would most likely be using leverages to achieve significant amount of profit. The amount of concentration and analysis is much more heavy due to the time factor to get your trade right. For an investors, you basically buy and hold till the right price to sell. You have the luxury of time to wait for your choice of stock to appreciate in value. The disadvantage of this approach is that you would require much more capital in order to realise profits that supercede your active income.
Alot of people who I have chatted with usually tell me that they are traders. However when suffered with a bad trade, they refuse to cut their losses and ended up giving excuses that they would pick up the shares as they are long term investors. My view is that if they are investors, they should have use a different approach to pick their stocks, like looking at fundamentals of a company, 52 week price range and dividend, etc. As a trader, we do not have the benefit of time in our trade and it is essential that we cut losses and focus on other more profitable trade.
To be honest, it will be much better for you to focus on becoming a good investor and not a trader if you are holding on to a full time job/ business. This is because stock trading requires a lot of focus and energy, it will not allow you to split your focus on to some other things.
Last but not least, the short term market condition favours the long term investors rather than trader. There seems to be signs of weakness to the rally in the market for the moment in the short term, whereas the long term trend of stocks are moving upward. This is a good time for investor to accumulate stocks whenever the market heads down, hold till prices appreciate to the point whereby the P/E ratio is above 20 and consider selling from then.
Friday, August 14, 2009
Myths in stock trading
I have decided to list down some of the more common myths in stock trading. For purely entertainment purpose, you might wish to note it down and observe whether is it relevant.
- The market usually plunge when it is raining heavily on that day
- Stock price usually drop on Fri as trader do not want to hold over weekend position
- Stock price is at its highest during the 1st two hour of trading
- When stock price close high, the next day would most likely be bullish
- Sept is traditionally a bad month for stock trading
- Dec is usually a bullish mth
- When there is a holiday on fri, the market will usually rally on the holiday eve
- 5 days before company release their result, the stock price would usually be on an upward trend. However, once the result is out, it will usually drop. Classic case of buy on anticipation and sell on news
- Stock price would usually be appreciating before CUM dividend date due to buyers buying for the sake of dividend. However, price would usually drop after ex-dividend.
Hope the above might be of certain use to you. Again, do trade with care as the stock market is very dynamic. No one can be a master when it comes to trading stocks. We can only increase the probability of winning and certainty is always the definite myth. Good luck!!
Thursday, August 13, 2009
How to read the price of a stock
I have just met a friend who told me that she is having problem understanding the basic of reading the price of a stock. Therefore, i decided to include an explaination on this topic in my blog today. There is three component which you look at when we talk about stock price.
- Last done Price: This is the price which the stock was last transacted
- Buy Price: The price which buyer are willing to buy from you
- Sell Price: The price which seller are willing to sell to you
Example, last done price for XYZ Ltd is $1/ share. However buy price is $0.99 and sell price is $1. As a buyer, you would only be able to buy the stock if you are willing to pay $1 for it. For a seller, you would need to sell at $0.99 if yo u want to sell your shares. You are allowed to queue for the price that you want to sell/ buy provided that it is within ten bids from the last done price.
So what is this bids that i am referring to? For shares that are priced above $1, each bid will be $0.01, example $1.01, follow by $1.02. For shares that are priced $1 and below, each bid will be $0.005, example $0.9, follow by $0.905.
Hope the above is able to help you with the basic of reading stock price. Good luck and have fun trading.
Wednesday, August 12, 2009
More functionality added
Some of my friends have been asking me for stock picks lately. It seems to me that the best way to publish my picks is via tweeter. I shall be updating some of my perceived opportunities in my tweets which will be reflected in my blog from time to time. Since i am a trader, i trade stocks on a very short time frame, therefore my pick will expire on that day that i post it. Do visit my blog often for any potential good pick. Please take note that my stock picks are meant for your reference and are not a guarantee means to make money.
Is the Singapore Market heading for correction??
Due to recent market volatitility, I have received a couple of queries with regards to the direction of the market in the short term. Some have asked me about the support for the straitstimes index whereas some have asked me whether is this a good time to buy stocks. It seems to me that the best way to reply to these queries will be via my blog. I shall begin my analysis using the straitstimes index chart as per closing today.

First and foremost, you will notice that the STI has been dropping since 04th Aug 2009. It has been on a consistent downward trend until 11th Aug 2009 when there was a mini rally. However, the index closed down today again. If you refer to my previous posting on how to read a chart, you will notice that the circled areas are all pointing towards a downward movement in the near term. Share prices is closing below the short term moving average, MACD showing bearish forces in play and stochastic oscillator also pointing towards bearish market sentiment. In my point of view, the market is heading for a correction at this point of time due to sharp appreciation of share prices for the last couple of weeks.
There is two outcome that is possible from my study of the chart. The market can either be heading for a consolidation which will most likely last for a few weeks before it begin to rally again. During this period of time, the market will sideway trading for awhile before eventually setting on a primary trend. This trend can either be up trend or down trend. Will need more market signal before i can comment. The second outcome will be market panic selling which results in share prices falling dramatically to pre-march 2009 level. As per the chart above, the moving average is at a junction of changing trend. There is a high possibility that the trend might reverse in the near term to a downward trend should the moving averages crossover.
The support for STI according to fibonacci retracement at 38.2% should be about 2536. The key support to look at will be 2485, this is the level at 50%. Once this support is breach, it will usually mean a reversal in trend. In my point of view, this would not be a good time to buy any stocks for the moment. It will be better to wait for the potential down trend to end before you make any purchase.
Monday, August 10, 2009
Present market condition
The current market in Singapore appears to be overbought technically. This applies to stock market across the world as well. In the short term, we can expect market to consolidate and drop slightly. From my analysis, prices should not drop too much. The stock prices has supercede the fundamental of the company earning potential in the short term. Therefore, a correction in stock price is inevitable unless there's further good news (example, second stimulas package) to boast the stock price further.
Thus, be very careful when you attempt to buy any stocks for this week. Basic commodities and energy related should be falling soon. There should be good buying opportunities on these counters once it start falling but you must monitor the charting till there is a firm case of up trend momentum. Remember to use the techniques which i have shared in my previous posting to identify high probability trading opportunity.
Tuesday, August 4, 2009
What moves the stock market
As much as i hate to say this, no one can predict the next price movement of the stock market. Even technical analysis will not be able to assist you with a 100% accuracy in prediction. The real factors that move the stock market are money flow, greed and fear. There are lots of big players in the market such as hedge funds, institution traders, the rich and affluent and syndicate. We as retail traders are consider as 'small fish' since we do not have sufficient money to move the stock market. In order to profit from our trading, we need to leverage on the movement of these 'big fish'.
When money flows into the stock market, it will inflate the price of the stock. Thereby creating a paper demand for that stock. As retail investors and traders begin to be attracted by the price appreciation of the stock, they will enter into the market. This will in turn further aid the appreciation on the stock price. On first sight, this is an idea situation whereby everyone is a clear winner as long as they buy the stock. However, problem will set in when greed comes into play. Stock price on theory should not be worth more than its earning potential. In order to justify the price appreciation, there must be growing anticipation on the potential of earnings. More often than not, stock price appreciate much more than it's potential earning power. This is what i would describe as overbought condition. As a result, 'big fish' will begin to take profit and exit the market which in turn causes the stock price to fall.
The irony with stock market is that it has very serious mood swing problem. Always swinging between extreme greed and extreme fear. When the 'big fish' starts to sell their stocks holding, it create massive market fear which results in retail investors and traders to dump their stock. This action creates panic selling pressure and causes stock price to fall sharply.
As a trader, we need to understand the basic mechanism on why stock price moves. This is important because it help us to understand the stage that we are in. If market is fearful, study the long term trend of the chart (usually the daily chart) using moving average and determine whether is this a temporary drop in share price. However, when market has been rising too much, make use of the moving average to identify potential reversal in uptrend as stock prices might start to plunge. There is a saying for traders, when the public are fearful, we long the stocks (buy the stock and hope price will rise). When the public is greedy, it is time to sell your stock and get out. If you notice, i use the word public and not 'big fish'. The reason is because 'big fish' are the trend starter whereas the public will always follow after them. The irony is that the public are usually the 'lamb' waiting to be slaughter as they enter the stock market last...
Last but not least, my blog has been gaining popularity and readership has been on the rise. Thank you for your support and do remember to click the google ads to show me your support.
Sunday, August 2, 2009
Reading a rally cycle
Based on my experience in trading, i have observe the following 'sympton' of Singapore market. The local market follows a pattern that resembles sector rotation during a bull rally. (Prices keep going upward) The first in the market to move would usually be the blue chip counters. And it will usually rally for a few days before it pause for consolidation. While the blue chip is consolidating, the mid cap company will have its turn to rally, stock priced above 0.2 will usually take this opportunity to rally. Once the blue chip and mid cap companies get over priced, it will be the penny stock turn to rally. The rationale is simple, when there's no further up side to the blue chip and mid cap counters, speculators turn their attention to small cap in a bid to ride on the bullish sentiment and attract more retail investors to invest in them. During a bull rally retail investors will usually be blinded by greed and jump into these penny stock without doing due dilligence.
There's two important point for my explaination on the above scenario. First and foremost, once you see penny stock in play, it is about time to take profit and exit the market for awhile. During these period of time, watch out for any positive news that will carry the rally further, if not, it might be time to stay away from buying any new stocks because the market might plunge anytime. So how do you see whether penny stocks are in play? The warning sign comes when penny stocks are in play (more than 80% of top 30 volume are make up of penny counters), blue chip and mid cap counters are no longer dominating the top 30 volume.
The second important point is that penny stock is worth investing when you have spare cash that you do not need. The rationale on investing in these companies is that you are simply buying a hope that these penny counters will get their chance to rally due to speculative play. And it usually will when the market sentiment is very bullish. However, please do not use contra trading for penny stocks as the liquidity is not there and you would not be holding the stock any time soon. You might not be able to find a buyer at the price that you are looking to sell. And the bid spread would usually be very wide. Example will be, buyer willing to pay only 0.05 whereas seller only willing to sell at 0.1. In this example, seller will incur 50% loss on capital if he/ she were to sell the stock to the buyer.
Penny stocks do not have any fundamentals in place and they are cheap for a reason. So do trade with care, exercise caution and trade with spare cash only.
To add to your bonus for reading my blog so far, i have listed a few penny stock below for your reference and study. These counters are not listed in order of popularity.
- Ellipsiz
- Centillion - Price usually move together with Centillion (related company)
- Penguin
- MediaRing
- Equation - Price usually move together with Centillion (related company)
- Digiland - Price usually move up one bid only so got to queue early to sell everyday
- Unifiber
- Sunmoon - Price usually move up one bid only so got to queue early to sell everyday
Wednesday, July 29, 2009
Tips to search for stock in Singapore for trading
The Singapore Stock Market is consider as small and not that developed when you compare it with the US market. This is both a blessing and a curse. It is a blessing because the limited sectors make it easier for beginner to scan for the right stocks to trade. However, due to the limited sectors, our opportunities to trade for profit get smaller. This is because of sector rotation when it comes to market rally or drop. Sectors of the industry will take turns to rally or drop significantly.
The main sectors that i focus on for trading in Singapore market are listed below. I tend to avoid blue chip stocks that cost more than $2SGD because the brokerage cost would be very high and will eat into my trading profit. However, some people prefer to trade these counters because of the liquidity offers. (Confirm got buyer and seller). For trading purpose, my advise would be to steer clear of penny stocks, stock that cost less than 0.20cent. Reason is because the liquidity might not be there at times, you might not be able to find a buyer when you want to sell. This is especially important to contra players. Focus and learn how to make money from the below sectors before you branch out further and explore other sectors.
- Palm Oil Sectors: Factors affecting the stock price includes crude palm oil index, crude oil price and US dollar exchange rates. When US dollar strengthen, crude oil price would usually drop, therefore crude palm oil index is expected to drop accordingly. This is because crude palm oil is a subsititute product for producing biofuel. Example, Indoagri, Goldenagri
- Offshore Marine sectors: Crude oil price is the single major factor that influences the price of the stock. The reason is because when crude oil price is high, more companies will award contract to offshore marine companies to dig oil from the sea. The cost for building a oil rig in the sea is much more expensive than drilling for oil on land. And it only make financial sense to increase demand for oil rig if the oil price is high. Example, Swiber, Sembawang Marine, Keppel corp
- Property sectors: Factors affectng the stock price includes interest rates, new home sales, existing home sales, anticipated future economic outlook and performance of banking stocks. Example, Allgreen, SC Global, Ho Bee, Capitaland, Keppel land.
- Shipping sectors: Factors affecting the stock price includes, baltic dry index (the freight rates), crude oil price. When crude oil price increases, cost of doing business increase so stock price would usually turn lower if baltic dry index do not correspond with the increase. Example, Cosco, NOL, Mercator
- Commodities sector: Raw material prices such as copper, steel, aluminium and coal. When these item increases in price due to shortages, the stock price of these counters will usually rise. Example, Noble, Olam, Straitsasia
Thursday, July 23, 2009
Types of technical indicators
Other than reading stock price chart, I make use of technical indicators to assist in confirming the trend. This technical indicators can be easily accessed from your brokerage firm and is usually provided for free. The purpose of a technical indicator is to provide additional confirmation on the trendline so that you can increase your probability of success on your trade. Please click on the image below to enlarge it for example of the indicators.
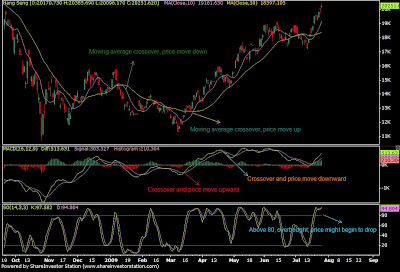
Trending Indicator:
- Simple Moving average crossover: Once the short term moving average cross above the longer moving average, it would usually signal a change in trend to move upward (price go up). When the short term moving average cross below the longer moving, it would usually signal a change in trend to move downward (price go down).
- MACD (Moving average convergence and divergence): Use to generate buy/ sell signal, however the accuracy will have to be combine with other indicator for enhance confirmation.
- Stochastic Oscillator (SO): Use to determine whether a particular stock is overbought/ oversold. I seldom use this to generate buy/ sell signal as it is too sensitive to price changes. I would usually use this in conjunction with MACD to confirm the trend.
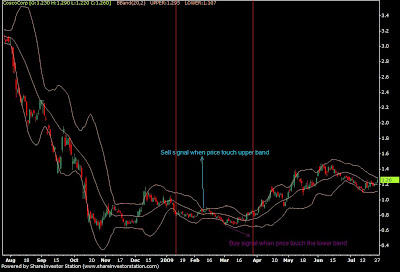
Sideway Indicator:
Ocasionally stock price would trade sideway so we would need to use different set of technical indicators catering to sideway trending market. Trending indicators do not work well for sideway market. The indicator that i prefer to use for sideway market is call bollinger band. When stock price hit the upper channel of the band, we would consider that as a sell signal, this upper channel will act as a resistence and prices should not be able to penetrate this upper limit. Whereas the lower band will act as a support for stock price and should not be able to drop below this price. The theory for this method is that prices would move in range bound and you should be trading within the boundaries of the bollinger band. We would trade using this method when market prices is consolidating after a huge price movement either upward or downward. Remember, stock price do not go up or down forever.
The above are just some of the technical indicators. There are many other indicators available. However, these few indicators has serve me well and i believe in keeping my chart as simple and clutter free as possible. There is no point in getting a complicated tehcnical indicators whereby you do not fully understand the benefit of using it.
Now that you have learn to use technical indicators, try to read up some charts using these indicators and try to forecast subsequent future price movements as a practice on paper. Beside technical indicators, we would need to combine it with chart patterns or candlestick to achieve better results. Pls visit the below site to gain a better understanding of how candlestick works.
http://www.candlesticker.com
I shall try to incorporate some candlestick usage and explanation in my next posting. In the mean time, feel free to drop me a comment on any topic that you might be interested in with regards to stock trading and I would do my best to answer them in the subsequent posting on my blog.
How to read a stock price chart

As I am writing this blog, the US market is rallying and Dow Jones has breached 9000points for the first time in 12mths. This is a milestone considering the fact that there was so much uncertainty in the market for trading. However, now that we have a clearer direction, it would be easier for us to trade for a profit. In order to do this, you must first learn the basic of chart reading.
On your top is a daily chart of Ho Bee, a counter listed in Singapore stock exchange. This chart was generated using a program called SI station. If you look at the chart closely, you will realise that there is green and red colour bar which we called 'Candlestick'. I personally use candlestick to study the trend of the chart, however, there are more variety of chart style available depending upon your liking. As a trader, we are concern about not trading against the trend. And if you notice the price chart, it is either trending upward or downward, gradually or sharply.
The red candle in the chart basically means that the closing price of the stock is lower than the opening price of it. Whereas a green candle shows that a closing price is higher than the opening. When you see candlestick that close higher and higher compared the previous few candles, you can see that a uptrend is forming. The reverse will lead to a down trend. Candlestick can also form various patterns which can theoritically help you to forecast the future price move. I shall dedicate an entire posting on the different common candlestick pattern to explain more in detail again.
Knowing how to interpret the chart is still not enough for you to begin trading. You must combine your knowledge with technical indicators to assist you in confirming the trend. Pls note that no combination can give you 100% accuracy in predicting stock price movement. We can only increase our chance of making money by trading certain setup which gives us a higher probability in making money.
Sunday, July 19, 2009
Strategy to use for stock screening
There are two schools of thoughts when it comes to investing. First being the fundamentalist and second the technical analyst. The fundamentalist basically look at financial statement of the company and study in detail the business environment and future prospect of the company before they make the decision to buy. Usually the time frames for holding the counters are relatively longer, 3 years or more. They would not sell the stock for a profit unless the fundamental of the business changes and is no longer consider as attractive to them.
The technical analyst on the other hand is interested in studying price chart of the stock and do not rely upon the fundamental of the company to make decision to buy or sell. They are basically more interested in the psychology of the market. Whether is the market in panic selling or panic buying mode, this is what the technical analyst is interested in.
This is my understanding of the two version of investing, explained in plain laymen term. To find out more in depth of the academic explanation, pls visit www.investopedia.com to find out more.
It is important to understand the difference between these two styles of investing. A lot of people begin with the mindset that they are investing for the long term so that makes them a fundamentalist. However they are constantly looking to sell for profit or cut loss when market rally or plunge. To me, this is not what a fundamentalist would do. As a result of such inconsistency in trading method, more often than not, the investor would lose money. Eventually, he/ she would lose confidence in stock trading. When you buy a stock and look to cash in for profit for the shortest point of time, it is very important that you know how to use technical analysis to find out the market sentiment. The fund manager and the rich are the ones who move the market. Therefore, it makes sense if we follow the trend of where the smart money is going into. Some people might question the feasibility of this method and would challenge that we should be the one who determine the direction of the stock price. However, I would like to ask you a simple question, is your capital for investing large enough and comparable to big funds institution? The answer is usually a big 'No'.
As per the objective of this blog, I am a full time trader, I am not an investor. I buy and sell stock for a living. Thus technical analysis is part and parcel of the tools that I use to base my decision upon. Short term trading of stocks requires a lot of hard work from your part and pls takes note that there are no easy lunches in stock trading. In the next few posting, I shall talk more about the different common technical analysis used to determine the market sentiment. But before I begin with that, I would cover the basic of how to read price chart of a stock in my next posting.
Friday, July 17, 2009
Brokerage firm details in Singapore
I have compiled a list of brokerage firms in Singapore that focus on either Singapore Stock Market or US Stock Market. And along in the details are the brokerage charges for trading with them. Please note that opening an account with them is free. However for foreign broker firm, you would need to make a deposit before you can begin to trade. The trading limit is the amount of funds that you have transfered to your account. However, for local brokerage firm, the deposit can usually be waive by simply speaking to the staff.
The local brokerage firm provides foreign market trading as well, however, the brokerage fees would be higher as they are require to go through a middleman from the country that you are trading in order to facilitate your trade. Depending upon your strategy, you might wish to open up multiple account so that you can enjoy the best rates of trading in US and Singapore market.
Singapore Market Trading:
Phillip Securities
- Brokerage Fees: 0.28%/ Min SGD$25
- Website address: www.poems.com.sg
Lim & Tan
- Brokerage Fees: 0.28%/ Min SGD$25
- Website address: www.limtan.com.sg
OCBC Securities
- Brokerage Fees: 0.275%/ Min SGD$25
- Website address: www.iocbc.com
DBS Vickers
- Brokerage Fees: 0.28%/ Min SGD$25
- Website address: www.dbsvickers.com
Kim Eng
- Brokerage Fees: 0.275%/ Min SGD$25
- Website address: www.ketrade.com.sg
UOB Kay Hian
- Brokerage Fees: 0.275%/ Min SGD$25
- Website address: www.uobkayhian.com.sg
US market trading:
Optionxpress
- Brokerage Fees: USD$16.95 or USD$0.0175 per share, whichever is higher
- Website address: www.optionxpress.com.sg
eTrade
- Brokerage Fees: USD$19.99
- Website address: www.etrade.com.sg
There are more brokerage firms out there but these are the more common ones that I am aware about. Different brokerage firms strength lies in different aspect. Some are strong in their trading platform, whereas some are cheap on the brokerage cost. Based on my personal opinion, i prefer to work with a local broker because of the personalise service provided. The higher commission paid is justifiable in my personal context. My broker from OCBC is able to perform on my behalf, to watch and screen the market sentiment. To me, this is an invaluable source of info which can help me to make money. However, not all dealers and remisers for local brokerage firms are able to provide such service as it is highly dependent upon your relationship with them in order for them to provide such personalise service to you. Feel free to let me know if you need a broker, i can recommend my broker from OCBC to you. His service has not disappoint me to far.
As i am typing out this blog, the Singapore market is getting into position to resume rallying. Do hope that you are among the fortunate to be able to ride on this bull rally and profit from it.
Differences in local and foreign brokerage firm
As a beginner in stock trading, you would need to open up an account with a brokerage firm in order to begin trading stocks. In the case of Singapore, you have the option to open an account with a local brokerage firm or a foreign brokerage firm.
Should i go for the brokerage firm that has the lowest brokerage fees?
Depending upon your trading style, whether are you a contra trader (without too much capital onhand to buy stock outright), trader(with the capital to buy stock outright) or investors. Local brokerage firm allows you to pay for your stock on T+3 basis. This basically means that you are given a total of 4working days including the day that you bought the stock to pay up for them. However, do bear in mind that this goodwill could be void if you default on your payment. Local brokerage firm charges almost the similar rates for their brokerage service. I shall write up a post detailing the different in cost for these local brokerage firms. You can use your atm (via EPS), internet banking account and walkin to deposit funds into your account. The money will usually be transfer directly into your bank account unless you instructed for cheque when you need to withdraw funds. This process will usually take between 2 to 3 working days.
Foreign brokerage firm on the other hand requires you to place a deposit with them upfront and you can only trade using the amounts that you have deposit with them. Some of these foregin brokerage firm do allow margin trading (a form of credit facilities that allow you to trade x multiples of your deposit). The mode of payment is usually by wire transfer. To withdraw funds, you would usually need to wait for the cheque from them or you can simply request for wire transfer which in this case would require you to pay a fee for this service. The benefit of a foreign brokerage firm is that their brokerage fees are cheaper and you have wider variety of markets available that you can trade.
Tuesday, July 14, 2009
Where should I begin if I am new to stock trading?
A common problem facing newbie who wants to trade stock is where do I begin. Most of us are entice by the prospect of home based career offered by stock trading and the potentially fantastic income that come along with the stock trading business. Being your own boss and customising your own schedule is surely a carrot that is hard to resist.
To begin as a stock trader, you would need to know the operating hours of the stock exchange. Based on Singapore Local time, the operating hour for Singapore Stock Exchange will be from 9.00am to 5.00pm. The second thing to learn is to open up an account with a brokerage firm. I shall touch on the various difference among some of the brokerage firm for your understanding in the next post. Thirdly, you would need to learn how to read price/ volume charts, technical indicators and trendline. I would be sharing with you some of the more common usage of these indicators. Fourthly, you would require a trading log to help you record down your transactions for analysis purposes. Lastly, you need to know where to find information, news and corporate events. Shall do an analytical breakdown for you to decide on whether to subscribe for a paid service or to use a free service.
Subscribe to:
Posts (Atom)

