Thursday, July 23, 2009

Types of technical indicators

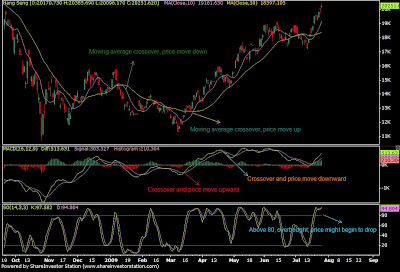
Other than reading stock price chart, I make use of technical indicators to assist in confirming the trend. This technical indicators can be easily accessed from your brokerage firm and is usually provided for free. The purpose of a technical indicator is to provide additional confirmation on the trendline so that you can increase your probability of success on your trade. Please click on the image below to enlarge it for example of the indicators.

Trending Indicator:
  1. Simple Moving average crossover: Once the short term moving average cross above the longer moving average, it would usually signal a change in trend to move upward (price go up). When the short term moving average cross below the longer moving, it would usually signal a change in trend to move downward (price go down).

  2. MACD (Moving average convergence and divergence): Use to generate buy/ sell signal, however the accuracy will have to be combine with other indicator for enhance confirmation.

  3. Stochastic Oscillator (SO): Use to determine whether a particular stock is overbought/ oversold. I seldom use this to generate buy/ sell signal as it is too sensitive to price changes. I would usually use this in conjunction with MACD to confirm the trend.
Sideway Indicator:

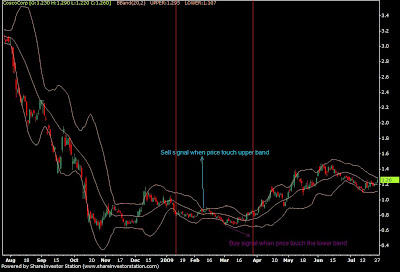
Ocasionally stock price would trade sideway so we would need to use different set of technical indicators catering to sideway trending market. Trending indicators do not work well for sideway market. The indicator that i prefer to use for sideway market is call bollinger band. When stock price hit the upper channel of the band, we would consider that as a sell signal, this upper channel will act as a resistence and prices should not be able to penetrate this upper limit. Whereas the lower band will act as a support for stock price and should not be able to drop below this price. The theory for this method is that prices would move in range bound and you should be trading within the boundaries of the bollinger band. We would trade using this method when market prices is consolidating after a huge price movement either upward or downward. Remember, stock price do not go up or down forever.


The above are just some of the technical indicators. There are many other indicators available. However, these few indicators has serve me well and i believe in keeping my chart as simple and clutter free as possible. There is no point in getting a complicated tehcnical indicators whereby you do not fully understand the benefit of using it.

Now that you have learn to use technical indicators, try to read up some charts using these indicators and try to forecast subsequent future price movements as a practice on paper. Beside technical indicators, we would need to combine it with chart patterns or candlestick to achieve better results. Pls visit the below site to gain a better understanding of how candlestick works.
http://www.candlesticker.com

I shall try to incorporate some candlestick usage and explanation in my next posting. In the mean time, feel free to drop me a comment on any topic that you might be interested in with regards to stock trading and I would do my best to answer them in the subsequent posting on my blog.

How to read a stock price chart


As I am writing this blog, the US market is rallying and Dow Jones has breached 9000points for the first time in 12mths. This is a milestone considering the fact that there was so much uncertainty in the market for trading. However, now that we have a clearer direction, it would be easier for us to trade for a profit. In order to do this, you must first learn the basic of chart reading.

On your top is a daily chart of Ho Bee, a counter listed in Singapore stock exchange. This chart was generated using a program called SI station. If you look at the chart closely, you will realise that there is green and red colour bar which we called 'Candlestick'. I personally use candlestick to study the trend of the chart, however, there are more variety of chart style available depending upon your liking. As a trader, we are concern about not trading against the trend. And if you notice the price chart, it is either trending upward or downward, gradually or sharply.

The red candle in the chart basically means that the closing price of the stock is lower than the opening price of it. Whereas a green candle shows that a closing price is higher than the opening. When you see candlestick that close higher and higher compared the previous few candles, you can see that a uptrend is forming. The reverse will lead to a down trend. Candlestick can also form various patterns which can theoritically help you to forecast the future price move. I shall dedicate an entire posting on the different common candlestick pattern to explain more in detail again.

Knowing how to interpret the chart is still not enough for you to begin trading. You must combine your knowledge with technical indicators to assist you in confirming the trend. Pls note that no combination can give you 100% accuracy in predicting stock price movement. We can only increase our chance of making money by trading certain setup which gives us a higher probability in making money.

Sunday, July 19, 2009

Strategy to use for stock screening

There are two schools of thoughts when it comes to investing. First being the fundamentalist and second the technical analyst. The fundamentalist basically look at financial statement of the company and study in detail the business environment and future prospect of the company before they make the decision to buy. Usually the time frames for holding the counters are relatively longer, 3 years or more. They would not sell the stock for a profit unless the fundamental of the business changes and is no longer consider as attractive to them.

The technical analyst on the other hand is interested in studying price chart of the stock and do not rely upon the fundamental of the company to make decision to buy or sell. They are basically more interested in the psychology of the market. Whether is the market in panic selling or panic buying mode, this is what the technical analyst is interested in.

This is my understanding of the two version of investing, explained in plain laymen term. To find out more in depth of the academic explanation, pls visit www.investopedia.com to find out more.

It is important to understand the difference between these two styles of investing. A lot of people begin with the mindset that they are investing for the long term so that makes them a fundamentalist. However they are constantly looking to sell for profit or cut loss when market rally or plunge. To me, this is not what a fundamentalist would do. As a result of such inconsistency in trading method, more often than not, the investor would lose money. Eventually, he/ she would lose confidence in stock trading. When you buy a stock and look to cash in for profit for the shortest point of time, it is very important that you know how to use technical analysis to find out the market sentiment. The fund manager and the rich are the ones who move the market. Therefore, it makes sense if we follow the trend of where the smart money is going into. Some people might question the feasibility of this method and would challenge that we should be the one who determine the direction of the stock price. However, I would like to ask you a simple question, is your capital for investing large enough and comparable to big funds institution? The answer is usually a big 'No'.

As per the objective of this blog, I am a full time trader, I am not an investor. I buy and sell stock for a living. Thus technical analysis is part and parcel of the tools that I use to base my decision upon. Short term trading of stocks requires a lot of hard work from your part and pls takes note that there are no easy lunches in stock trading. In the next few posting, I shall talk more about the different common technical analysis used to determine the market sentiment. But before I begin with that, I would cover the basic of how to read price chart of a stock in my next posting.

Friday, July 17, 2009

Brokerage firm details in Singapore

I have compiled a list of brokerage firms in Singapore that focus on either Singapore Stock Market or US Stock Market. And along in the details are the brokerage charges for trading with them. Please note that opening an account with them is free. However for foreign broker firm, you would need to make a deposit before you can begin to trade. The trading limit is the amount of funds that you have transfered to your account. However, for local brokerage firm, the deposit can usually be waive by simply speaking to the staff.

The local brokerage firm provides foreign market trading as well, however, the brokerage fees would be higher as they are require to go through a middleman from the country that you are trading in order to facilitate your trade. Depending upon your strategy, you might wish to open up multiple account so that you can enjoy the best rates of trading in US and Singapore market.

Singapore Market Trading:

Phillip Securities
  • Brokerage Fees: 0.28%/ Min SGD$25
  • Website address: www.poems.com.sg
Lim & Tan
  • Brokerage Fees: 0.28%/ Min SGD$25
  • Website address: www.limtan.com.sg
OCBC Securities
  • Brokerage Fees: 0.275%/ Min SGD$25
  • Website address: www.iocbc.com
DBS Vickers
  • Brokerage Fees: 0.28%/ Min SGD$25
  • Website address: www.dbsvickers.com
Kim Eng
  • Brokerage Fees: 0.275%/ Min SGD$25
  • Website address: www.ketrade.com.sg
UOB Kay Hian
  • Brokerage Fees: 0.275%/ Min SGD$25
  • Website address: www.uobkayhian.com.sg
US market trading:

Optionxpress
  • Brokerage Fees: USD$16.95 or USD$0.0175 per share, whichever is higher
  • Website address: www.optionxpress.com.sg
eTrade
  • Brokerage Fees: USD$19.99
  • Website address: www.etrade.com.sg

There are more brokerage firms out there but these are the more common ones that I am aware about. Different brokerage firms strength lies in different aspect. Some are strong in their trading platform, whereas some are cheap on the brokerage cost. Based on my personal opinion, i prefer to work with a local broker because of the personalise service provided. The higher commission paid is justifiable in my personal context. My broker from OCBC is able to perform on my behalf, to watch and screen the market sentiment. To me, this is an invaluable source of info which can help me to make money. However, not all dealers and remisers for local brokerage firms are able to provide such service as it is highly dependent upon your relationship with them in order for them to provide such personalise service to you. Feel free to let me know if you need a broker, i can recommend my broker from OCBC to you. His service has not disappoint me to far.

As i am typing out this blog, the Singapore market is getting into position to resume rallying. Do hope that you are among the fortunate to be able to ride on this bull rally and profit from it.


Differences in local and foreign brokerage firm

As a beginner in stock trading, you would need to open up an account with a brokerage firm in order to begin trading stocks. In the case of Singapore, you have the option to open an account with a local brokerage firm or a foreign brokerage firm.

Should i go for the brokerage firm that has the lowest brokerage fees?

Depending upon your trading style, whether are you a contra trader (without too much capital onhand to buy stock outright), trader(with the capital to buy stock outright) or investors. Local brokerage firm allows you to pay for your stock on T+3 basis. This basically means that you are given a total of 4working days including the day that you bought the stock to pay up for them. However, do bear in mind that this goodwill could be void if you default on your payment. Local brokerage firm charges almost the similar rates for their brokerage service. I shall write up a post detailing the different in cost for these local brokerage firms. You can use your atm (via EPS), internet banking account and walkin to deposit funds into your account. The money will usually be transfer directly into your bank account unless you instructed for cheque when you need to withdraw funds. This process will usually take between 2 to 3 working days.

Foreign brokerage firm on the other hand requires you to place a deposit with them upfront and you can only trade using the amounts that you have deposit with them. Some of these foregin brokerage firm do allow margin trading (a form of credit facilities that allow you to trade x multiples of your deposit). The mode of payment is usually by wire transfer. To withdraw funds, you would usually need to wait for the cheque from them or you can simply request for wire transfer which in this case would require you to pay a fee for this service. The benefit of a foreign brokerage firm is that their brokerage fees are cheaper and you have wider variety of markets available that you can trade.


Tuesday, July 14, 2009

Where should I begin if I am new to stock trading?

A common problem facing newbie who wants to trade stock is where do I begin. Most of us are entice by the prospect of home based career offered by stock trading and the potentially fantastic income that come along with the stock trading business. Being your own boss and customising your own schedule is surely a carrot that is hard to resist.

To begin as a stock trader, you would need to know the operating hours of the stock exchange. Based on Singapore Local time, the operating hour for Singapore Stock Exchange will be from 9.00am to 5.00pm. The second thing to learn is to open up an account with a brokerage firm. I shall touch on the various difference among some of the brokerage firm for your understanding in the next post. Thirdly, you would need to learn how to read price/ volume charts, technical indicators and trendline. I would be sharing with you some of the more common usage of these indicators. Fourthly, you would require a trading log to help you record down your transactions for analysis purposes. Lastly, you need to know where to find information, news and corporate events. Shall do an analytical breakdown for you to decide on whether to subscribe for a paid service or to use a free service.